Data Process Labs
☰
All projects

Data & Analytics

Turn Existing Dashboards into Interactive AI Analytics Experiences

AI-powered analytics dashboard — demonstrated through a GitHub example.

AI-Powered Analytics Dashboard

Add a conversational AI layer to an existing dashboard so users can ask questions in natural language, explore underlying data, and get answers beyond predefined charts and metrics.

The dashboard uses GitHub data as a practical example. The same approach can be adapted to sales, finance, operations, marketing, and customer analytics.

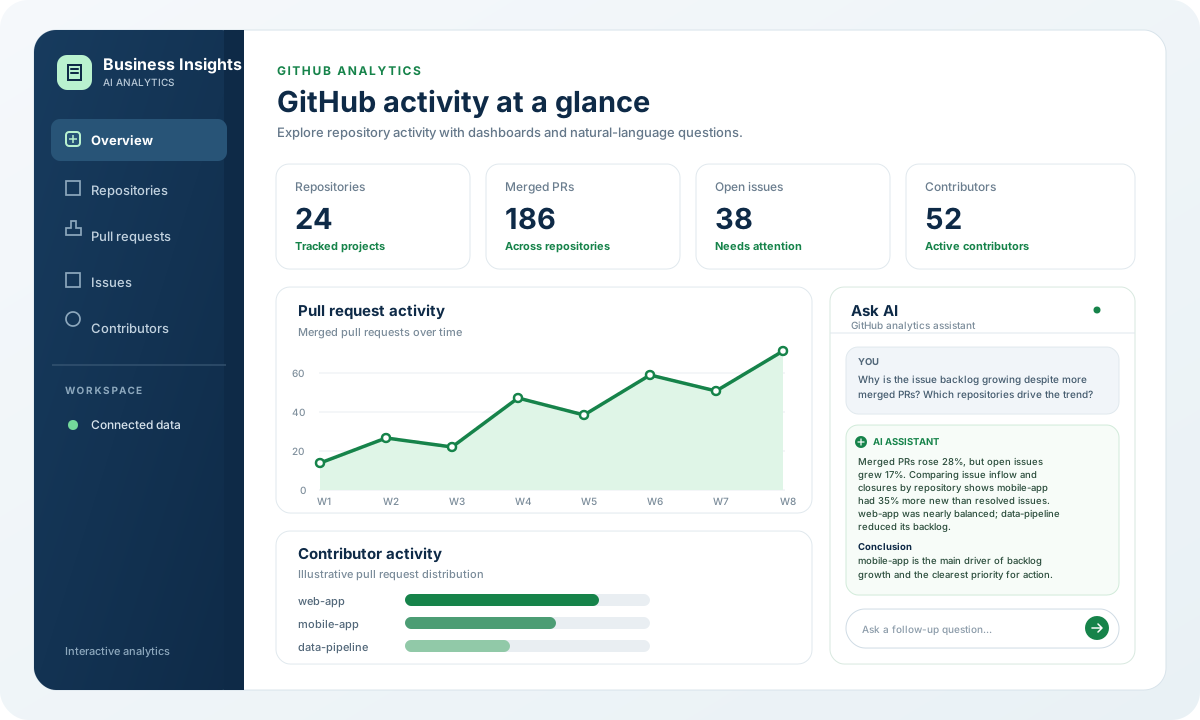
Illustrative business analytics dashboard with KPI cards, performance trends, sales, marketing and operations comparisons, and natural-language querying

The Challenge

Business dashboards make important metrics visible, but they often provide only predefined views. When users need to investigate an unexpected change or ask a new question, they may need SQL skills, analyst support, or a separate report.

This can limit how easily teams explore their own data:

  • Dependence on technical skills: Answering questions outside predefined views can require SQL knowledge or analyst support.
  • Limited exploration: Fixed charts and metrics do not anticipate every follow-up question a business user may have.
  • Slower decisions: Teams may wait for custom queries or reports before they can investigate performance changes.
  • Underused data: Useful information may remain difficult to access even when the underlying data is already available.
The Approach

Add an agentic conversational analytics layer to an existing dashboard. Rather than relying on one predefined query, the agent can inspect the available data, run focused queries to investigate different parts of a question, combine the results, and produce a complete answer in context. GitHub data demonstrates the pattern.

  • Let users ask questions in natural language, without needing to write SQL for every investigation.
  • Allow the agent to discover relevant tables, schemas, and field values before choosing how to investigate the question.
  • Break complex questions into focused data checks, run multiple queries where useful, and synthesize their results into one coherent answer.
  • Use query results and execution feedback to refine the investigation or recover from query errors when needed.
  • Apply appropriate data-access permissions and query safeguards for the connected data source.
  • Preserve familiar dashboard charts and KPIs while adding conversational exploration for questions those visuals do not answer on their own.

The Solution

The AI agent investigates a business question by exploring available data, selecting and executing relevant queries, combining evidence from multiple outputs, and explaining the conclusion in plain language. It works alongside the existing dashboard rather than replacing established reporting.

Agentic analytics in action

The agent investigates, connects the evidence, and answers

Instead of relying on one predefined query, the agent determines what to investigate, gathers evidence from multiple queries, and synthesizes the findings into a complete response.

1 · Business question

“Why is the issue backlog growing despite more merged PRs, and which repositories drive the trend?”

2 · Agent plans the investigation

Identifies the comparisons needed: merged pull requests, issue inflow versus closures, and differences across repositories.

3 · Multiple focused queries

Run as needed

Pull request trend

Measure how merged PRs changed over time.

Issue inflow vs. closure

Compare newly opened issues with resolved issues.

Repository comparison

Locate where backlog growth is concentrated.

The agent can use query results and execution feedback to refine the investigation or recover from query errors.

4 · Combine and interpret

Connects the query results to distinguish an overall trend from the repository-level factors driving it.

5 · Complete answer

A conclusion, not just query results

“Merged PRs rose 28%, while open issues grew 17%. The increase is concentrated in mobile-app, where new issues exceeded resolved issues by 35%. web-app was nearly balanced, while data-pipeline reduced its backlog. mobile-app is the main driver of overall backlog growth.”

Read-only data accessQuery validationExecution feedbackResults synthesized in context

Results

The dashboard combines familiar visual reporting with conversational analytics to help teams investigate trends, explore underlying data, and get more value from the information they already have.

  • Deeper use of existing dashboards: Let users investigate trends, compare segments, and ask follow-up questions beyond the predefined charts and metrics.

  • Get more from your existing team: Help business users answer routine data questions independently so analysts can focus on complex investigations and higher-value work.

  • Quicker answers to business questions: Explore metrics through natural-language queries instead of waiting for every new question to be turned into a custom report.

Potential Business Applications

AI-powered conversational analytics can be added to many existing dashboards, using the data and business definitions relevant to each team. The following are potential applications; each would require suitable data access and configuration.

Sales and CRM dashboards

Let teams investigate pipeline changes, compare conversion trends, and explore sales performance using natural-language questions.

Finance dashboards

Help users examine spending patterns, compare financial metrics, and investigate variances across periods or business units.

Operations dashboards

Enable teams to explore operational trends, compare performance indicators, and investigate exceptions beyond predefined reports.

Marketing dashboards

Let users explore campaign performance, compare channels, and investigate changes in engagement or conversion metrics.

Customer analytics dashboards

Help teams investigate customer segments, compare behavioural trends, and explore patterns across customer metrics.

Related Case Studies

Explore other projects with related business or technical patterns.

AI Solutions

AI Research Assistant for Complex Research Tasks

View project

AI Solutions

AI Website Assistant for Customer Questions

View project

Have a Similar Challenge?

Tell us about the process, customer experience, or research challenge you want to improve. We can discuss an appropriate approach and practical next steps.